Conditional font size — DAX recipes
The Font Size slice on the Value, Category Label and Prefix Label cards supports conditional formatting (the small fx button). The size in pixels can therefore be driven by a DAX measure — useful when several MetricTile visuals share a page and you want the most important one to stand out.
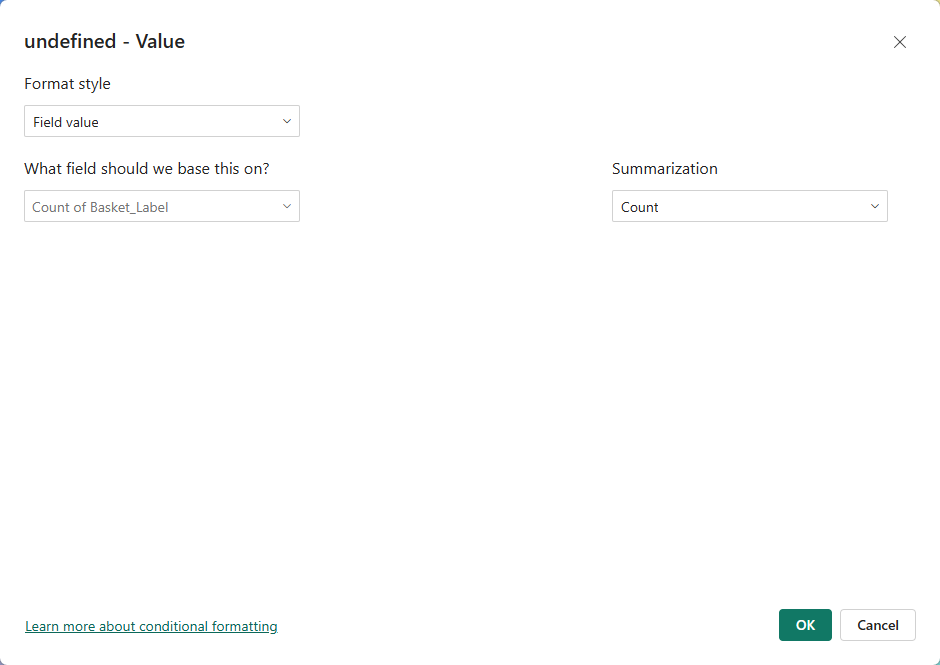
How to bind a measure to font size
- Open the Format pane and expand Value (or Category Label / Prefix Label).
- Hover over Font Size and click the fx icon that appears.
- In the dialog, choose Format style → Field value and pick the measure that returns the size in pixels.
The measure must return a number in pixels (integer or float). MetricTile clamps the rendered size to the slider range (
4 px–200 px).
Why this isn't as simple as it sounds
"Make the font proportional to the value" sounds trivial. In practice the hard part isn't the math — it's defining what "the values" means. Proportional to what?
A measure plugged into fx runs once per tile, with that tile's full filter context. To compute a min/max envelope, the measure has to look at other values too — but which others? The answer depends on the page architecture, and it changes the formula you write.
Two questions to answer before writing the measure:
- What is the "universe"? Should the min/max envelope respect page slicers (year, region…) or span the entire dataset?
- Where does the per-tile category come from? Is it a row inside a multi-data-point visual (Category role bound), or a filter pinned on the visual itself?
Getting either wrong produces formulas that look right but return constant values, zero ranges, or wildly out-of-range font sizes.
The three filter-removal functions
DAX gives you three ways to "open up" the filter context, with very different scopes:
| Function | Page slicers | Page filters | Visual filters | Effect on the column |
|---|---|---|---|---|
ALLSELECTED ( table[col] ) | kept | kept | kept | Returns the values selected at the visual level — including any filter pinned on the visual |
ALL ( table[col] ) | kept | kept | kept | Surgical: only filters on this exact column are dropped |
ALL ( table ) | removed | removed | removed | Universe-wide reset on the whole table |
Key insight: ALLSELECTED does not mean "ignore everything except page slicers". It means "give me what the user selected at the visual level". A filter pinned via the Filters on this visual pane is part of that selection — ALLSELECTED preserves it. If your tile has a per-visual filter for Earth, ALLSELECTED ( Planet[Label] ) returns { Earth }, not the full planet list, and your range collapses to zero.
Picking the right tool
| Page architecture | Right tool | Why |
|---|---|---|
| One visual, several data points (Category data role bound, the visual draws several tiles) | ALLSELECTED ( table[col] ) | Peers come from sibling rows of the same visual |
| N tiles, one visual each, no per-visual filter | ALLSELECTED ( table[col] ) or ALL ( table[col] ) | Both work; ALL is more explicit |
| N tiles, one visual each, per-visual filter (common — one tile per brand, region, KPI…) | ALL ( table[col] ) | The per-visual filter must be opened up; page slicers (year, region) stay |
| Universe-wide bounds, ignore everything | ALL ( table ) | The envelope is constant across pages and filters |
The recipes below show the two main cases.
Recipe 1a — Multi-data-point visual (Category role bound)
Use this when your page has one MetricTile drawing several tiles through the Category data role. ALLSELECTED correctly returns the visible peer set:
Value Font Size (Auto Scale, single visual) =
VAR MinFont   = 8
VAR MaxFont   = 40
VAR CurrValue = [Sales]
VAR Peers =
    CALCULATETABLE (
        VALUES ( 'Product'[Category] ),
        ALLSELECTED ( 'Product'[Category] )
    )
VAR SeriesMin = MINX ( Peers, CALCULATE ( [Sales] ) )
VAR SeriesMax = MAXX ( Peers, CALCULATE ( [Sales] ) )
VAR Range     = SeriesMax - SeriesMin
RETURN
    IF (
        Range = 0,
        ( MinFont + MaxFont ) / 2,
        MinFont + ( CurrValue - SeriesMin ) / Range * ( MaxFont - MinFont )
    )
Slicers and page filters narrow the peer set — usually what you want.
Recipe 1b — N independent tiles with per-visual filters
Each tile is its own MetricTile visual, and you pin a different category on each one through the Filters on this visual pane (one tile = Earth, the next = Mars, etc.). This is the most common layout for dashboards.
ALLSELECTED would preserve the per-visual filter and the peer set would collapse to a single row, so the range is zero. You need ALL on the category column to surgically remove that filter while keeping page slicers and filters intact:
Value Font Size (Auto Scale, per-tile filter) =
VAR MinFont   = 8
VAR MaxFont   = 40
VAR CurrValue = [Sales]
VAR Peers =
    CALCULATETABLE (
        ADDCOLUMNS (
            VALUES ( 'Product'[Category] ),
            "@v", CALCULATE ( [Sales] )
        ),
        ALL ( 'Product'[Category] )
    )
VAR SeriesMin = MINX ( Peers, [@v] )
VAR SeriesMax = MAXX ( Peers, [@v] )
VAR Range     = SeriesMax - SeriesMin
RETURN
    IF (
        Range = 0,
        ( MinFont + MaxFont ) / 2,
        MinFont + ( CurrValue - SeriesMin ) / Range * ( MaxFont - MinFont )
    )
Walking through the runtime for the Earth tile, on a page slicered to year = 2025:
CurrValue= Earth's sales in 2025 (per-tile filter applies to this measure call)Peers= every category's sales in 2025 (year preserved, category filter dropped)SeriesMin/SeriesMax= bounds across the full category set in 2025
Slicers and page filters still narrow the universe — only the per-tile category is opened up.
To ignore page slicers as well (constant envelope across the whole dataset), replace ALL ( 'Product'[Category] ) with ALL ( 'Product' ).
Recipe 2 — Fixed scale (known value range)
You know in advance that your value lives between 1 and 100 (e.g. a survey score, a percentage, a rating). You want 1 → 10 px and 100 → 60 px.
This is just a linear interpolation — no ALLSELECTED / ALL needed because the bounds are constants:
Value Font Size (Fixed 1-100) =
VAR ValueMin = 1
VAR ValueMax = 100
VAR FontMin  = 10
VAR FontMax  = 60
VAR Curr     = [Score]
RETURN
    FontMin + ( Curr - ValueMin ) / ( ValueMax - ValueMin ) * ( FontMax - FontMin )
Reading the formula:
(Curr - ValueMin) / (ValueMax - ValueMin)→ normalized position in[0, 1]* (FontMax - FontMin)→ re-scaled to the target px range+ FontMin→ shifted so thatCurr = ValueMinyieldsFontMin
If the value can fall outside the expected range, clamp it before scaling:
VAR ClampedCurr = MIN ( MAX ( Curr, ValueMin ), ValueMax )
Recipe 3 — Logarithmic scale (large-spread values)
When values span several orders of magnitude (e.g. 100, 2 500, 120 000), a linear scale crushes the small ones. A log scale gives a more legible result. The pattern below uses Recipe 1b's surgical ALL — adapt to ALLSELECTED if you're in the multi-data-point case (Recipe 1a):
Value Font Size (Log Scale) =
VAR MinFont   = 10
VAR MaxFont   = 50
VAR CurrValue = [Sales]
VAR Peers =
    CALCULATETABLE (
        ADDCOLUMNS (
            VALUES ( 'Product'[Category] ),
            "@v", CALCULATE ( [Sales] )
        ),
        ALL ( 'Product'[Category] )
    )
VAR LogMin = LN ( MAX ( MINX ( Peers, [@v] ), 1 ) )
VAR LogMax = LN ( MAX ( MAXX ( Peers, [@v] ), 1 ) )
VAR LogCur = LN ( MAX ( CurrValue, 1 ) )
VAR Range  = LogMax - LogMin
RETURN
    IF (
        Range = 0,
        ( MinFont + MaxFont ) / 2,
        MinFont + ( LogCur - LogMin ) / Range * ( MaxFont - MinFont )
    )
MAX ( …, 1 ) guards against LN(0). Use a different floor (e.g. 0.01) if your values are smaller than 1.
Debugging tips
When the rendered font size doesn't match expectations, the problem is almost always filter context, not arithmetic. Drop a Table visual on the page with the same category as your tiles, and add three diagnostic measures to inspect what the formula sees:
Debug_Curr = [Sales]
Debug_Min  = MINX ( <Peers expression>, CALCULATE ( [Sales] ) )
Debug_Max  = MAXX ( <Peers expression>, CALCULATE ( [Sales] ) )
Read the table:
Min = Max = Curron a single row → the peer set has collapsed to one element. Your filter-removal function isn't dropping what you think it is (typical sign thatALLSELECTEDis preserving a per-visual filter — switch toALL).MinandMaxlook correct but the current row'sCurrdoesn't fall between them → the per-tile filter isn't aligned with your category column.- The range looks much wider than expected → you've probably used
ALL ( table )instead ofALL ( table[col] )and dropped the page slicers too.
General tips
- Keep the px range comfortable:
8 pxis the practical minimum for legibility; above60 pxyou may run out of room in narrow tiles. The visual still clamps to4–200 pxto avoid degenerate sizes. - Combine with Display Units: dynamic font size pairs naturally with Auto display units — the smallest tiles will round to
K/M, the largest will show full digits. - Apply the same recipe to Category Label and Prefix Label if you want the whole text block to scale — bind the same measure (or a derivative) to each card's Font Size fx slot.